PROGRAM: P-15
Title:
THIRTEEN YEARS DAILY AND ANNUAL MEAN LAND SURFACE TEMPERATURE AND FROST NUMBER INDEX DATASET OVER THIRD POLE BASED ON MODIS INSTANTANEOUS LST PRODUCTS2CAS Center for Excellence in Tibetan Plateau Earth Sciences, Beijing 100101, China
Abstract:

The Qinghai-Tibet plateau (QTP), called as “the third pole of the earth” is the water tower of Asia not only feed
tens of millions of people, but also maintain fragile ecosystems in arid region of northwestern China.
Temporal-spatially complete representations of land surface temperature are required for many purposes in
environmental science, especially in third pole where the traditional ground measurement is difficult and
therefore the data is sparse. Although the Moderate Resolution Imaging Spectroradiometer (MODIS) instrument
has been designed to provide improved monitoring for land surface temperature (LST) since 2000, it is
instantaneous and susceptible to the influence of clouds. A temporal-spatially complete representation of land
surface temperature is still not available in third pole.
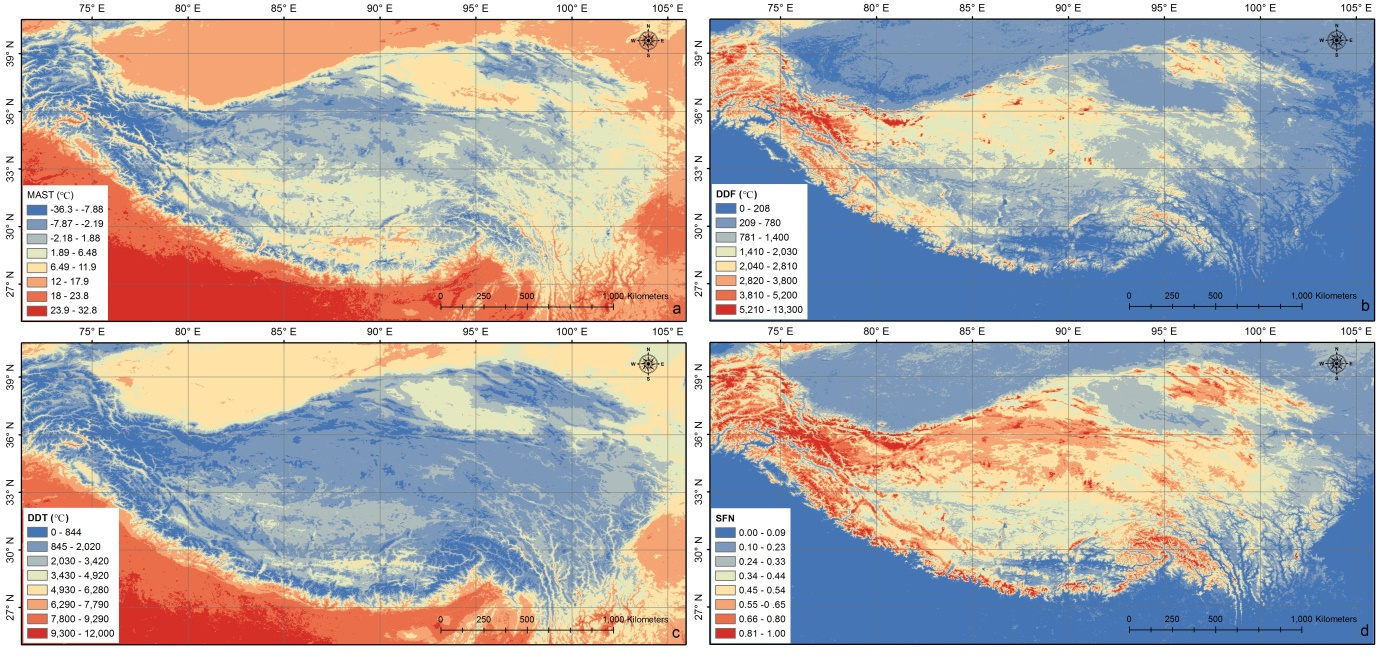
In this study, a pragmatic data processing method proposed by Ran et al. (2015) was used in this study to
estimate the daily mean LST, MAST, as well as freezing index, thawing index, and SFN based on the original
MOD11A1 and MYD11A1 LST product. It realized the spatial expansion of daily mean LST using spatial
interpolated daily LST amplitude based on the assumption that the arithmetic average of the daytime and
nighttime LSTs can represent the daily mean LST with an acceptable error, and the LST daily amplitude is more
homogeneous than LST itself. This assumptions are usually well established (Mitchell and Jones, 2005; Liu et al.,
2006). Therefore, the instantaneous LST value at any time and any pixel are full used to estimate daily mean LST.
After the processing use the method mentioned above, the daily mean LST is enhanced and then a gap filling
procedure was used to retrieve the remaining missing values and reconstruct the time serial of daily mean LST
based on a new robust smoothing algorithm, i.e. penalized least square regression based on discrete cosine
transforms (DCT), which explicitly utilizes information from time-series to predict the missing values (Garcia,
2010). A more detailed description of this scheme can be found in Ran et al., (2015) and Ran et al., (2017a).
This paper released the datasets of daily mean LST, mean annual land surface temperature (MAST), freezing and
thawing indices (the degree-day totals above and below 0°C), and surface frost number (SFN) during 2004 to
2016 from the quartic daily MODIS Terra/Aqua LST products with a resolution of 1 km using a robust data
processing algorithm. A total of 29 full year LST measurements at 9 radiance-based sites in QTP are used to
validate the estimated daily mean LST and MAST. Results show that the systematic error is remains for daily
mean LST and MAST, with a bias of -1.73°C (±3.38°C) and -2.07°C (±1.05°C), respectively. The systematic
overestimation of the daily mean LST lead to a underestimation of frost number. The underestimation of SFN for
warm area is more than that for cold area. The overestimation of the DDT and underestimation of DDF both
contribute to the underestimation of SFN.
The dataset is potential useful for various studies, including climatology, hydrology, meteorology, ecology,
agriculture, public health, and environmental monitoring in third pole and around regions. The trend analysis of
the time series MAST shows that the cold region is warming but the arid region is cooling in the past 13 years
over third pole. Comprehensive analysis indicates that the warming cold region cooling the arid region mainly
via hydrological cycle.
This is part of the paper Ran et al. (2017b), which have been submitted to Earth System Science Data.
Acknowledgements:
This study was jointly supported by two National Natural Science Foundation of China projects (grant numbers 41471359 and 91425303) and the Youth Innovation Promotion Association of the Chinese Academy of Sciences (grant number 2016375).
References:
Ran, Y., Li, X., Jin, R., & Guo, J. (2015) Remote sensing of the mean annual surface temperature and surface
frost number for mapping permafrost in China. Arctic, Antarctic, and Alpine Research, 47(2), 255-265.
Ran, Y.H., Li, X., & Cheng, G.D. (2017a) A permafrost thermal stability map over third pole by integrated
remotely sensed land surface temperature, leaf area index, soil properties, and ground boreholes measurement.
Submitted to Remote Sensing of Environment.
Ran, Y., Li, X., Yang, K., Meng, X.H., and Wang, S.Y. (2017b) Thirteen years daily and annual mean land
surface temperature and frost number index dataset over third pole based on MODIS instantaneous LST products.
Submitted to Earth System Science Data.
Mitchell, T. D., & Jones, P. D. (2005) An improved method of constructing a database of monthly climate
observations and associated high‐resolution grids. International journal of climatology, 25(6), 693-712.
Liu, X. D., Yin, Z.Y., Shao, X. M., and Qin, N. S. (2006) Temporal trends and variability of daily maximum and
minimum, extreme temperature events, and growing season length over the eastern and central Tibetan Plateau
during 1961–2003. Journal of Geophysical Research, 111(D19109).
Garcia, D. (2010) Robust smoothing of gridded data in one and higher dimensions with missing values.
Computational Statistics & Data Analysis, 54, 1167-1178.